

This feature is only available to customers on specific Maia plans. Visit the Maia Pricing page to learn more.
- What was the data source?
- How has the data changed through data transformations?
- What is the final destination of the data?
- Audit and compliance: Quickly track data back to its source for governance and troubleshooting.
- Impact analysis: Understand how upstream data changes affect downstream processes. For more information, read Filtering data lineage.
- Faster debugging: Identify issues at the source when data isn’t behaving as expected.
Video example
Video
Video
Accessing data lineage
Lineage is collected for each dataset used in your pipelines. To access lineage:- Log in.
- In the left navigation, click Activity, then select Lineage from the menu.
- If you have previously used this feature, a list of tables will be displayed. Choose one to see lineage information.
- The Lineage viewer isn’t a full schema view of your cloud data warehouse; it shows only those datasets that you have used in running pipelines.
Supported data sources
Lineage is available for all orchestration and transformation pipelines. The following connectors are supported as data sources:- Amazon DynamoDB Load
- Amazon Redshift Load
- Bing Ads Load
- Elasticsearch Load
- Email Load
- Excel Load
- Facebook Ads
- Facebook Load
- Gmail
- Google Ads Load
- Google Analytics
- Google BigQuery Load
- Google Sheets
- HubSpot Load
- IBM Db2 for i Load
- Jira Load
- LDAP Load
- LinkedIn Ads
- Mailchimp
- MariaDB Load
- Marketo Load
- Microsoft Dynamics 365 Load
- Microsoft Dynamics CRM Load
- Microsoft SQL Server Load
- MongoDB Load
- NetSuite SuiteAnalytics Load
- Oracle Eloqua Load
- Oracle Fusion Cloud Financials Load
- Oracle Fusion Cloud HCM Load
- Oracle Fusion Cloud Procurement Load
- Oracle Fusion Cloud Project Management Load
- Oracle Load
- Pendo
- Pipedrive
- PostgreSQL Load
- Sage Intacct Load
- Salesforce Load
- SAP NetWeaver Load
- ServiceNow Load
- SharePoint Load
- Shopify Load
- Slack
- Snowflake Load
- Stripe Load
- SugarCRM Load
- SurveyMonkey
- Sybase ASE Load
- Workday Load
- X Ads Load
- Zendesk Talk
- Zendesk Ticketing
- Zoho CRM Load
- Zuora Bulk
There’s no limit on how many levels of upstream or downstream lineage can be displayed. If lineage isn’t loading for a pipeline, check that all connectors involved are in the supported list above.
Using lineage
The lineage for a dataset is visually represented on a canvas in a diagram called a lineage graph. This graph depicts the various states the data undergoes as it moves through a transformation pipeline. The following example illustrates what you can expect to see in a transformation pipeline: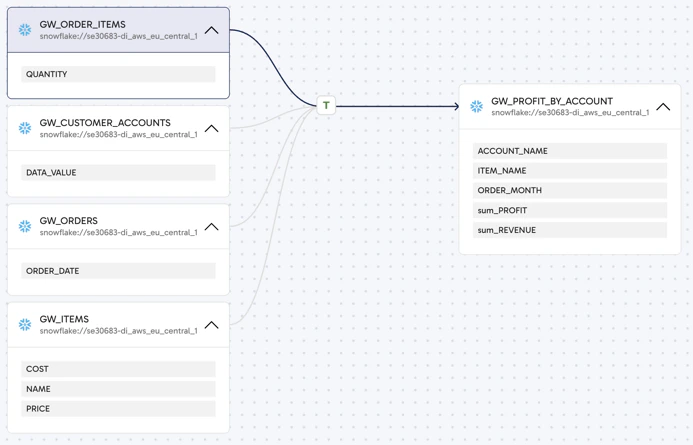
- Zoom in and out using the controls at the bottom-right.
- Drag the canvas around the window with your mouse.
- Drag individual boxes (datasets) around the canvas to reorganize the view (the relationships between the datasets will remain unchanged).
-
Click a transformation icon, T, to open a panel giving you the following details:
- Name of the pipeline.
- Name of the project containing the pipeline.
- Status of the most recent pipeline run (SUCCESS, FAILURE).
- Date and time that the most recent pipeline run started and finished.
- Approximate duration of the most recent pipeline run, in seconds.
- The name of the user who most recently ran the pipeline.
- Click any dataset box to show information about that dataset in a panel on the right. This panel includes a Columns tab which shows the name and data type of every column in the dataset.
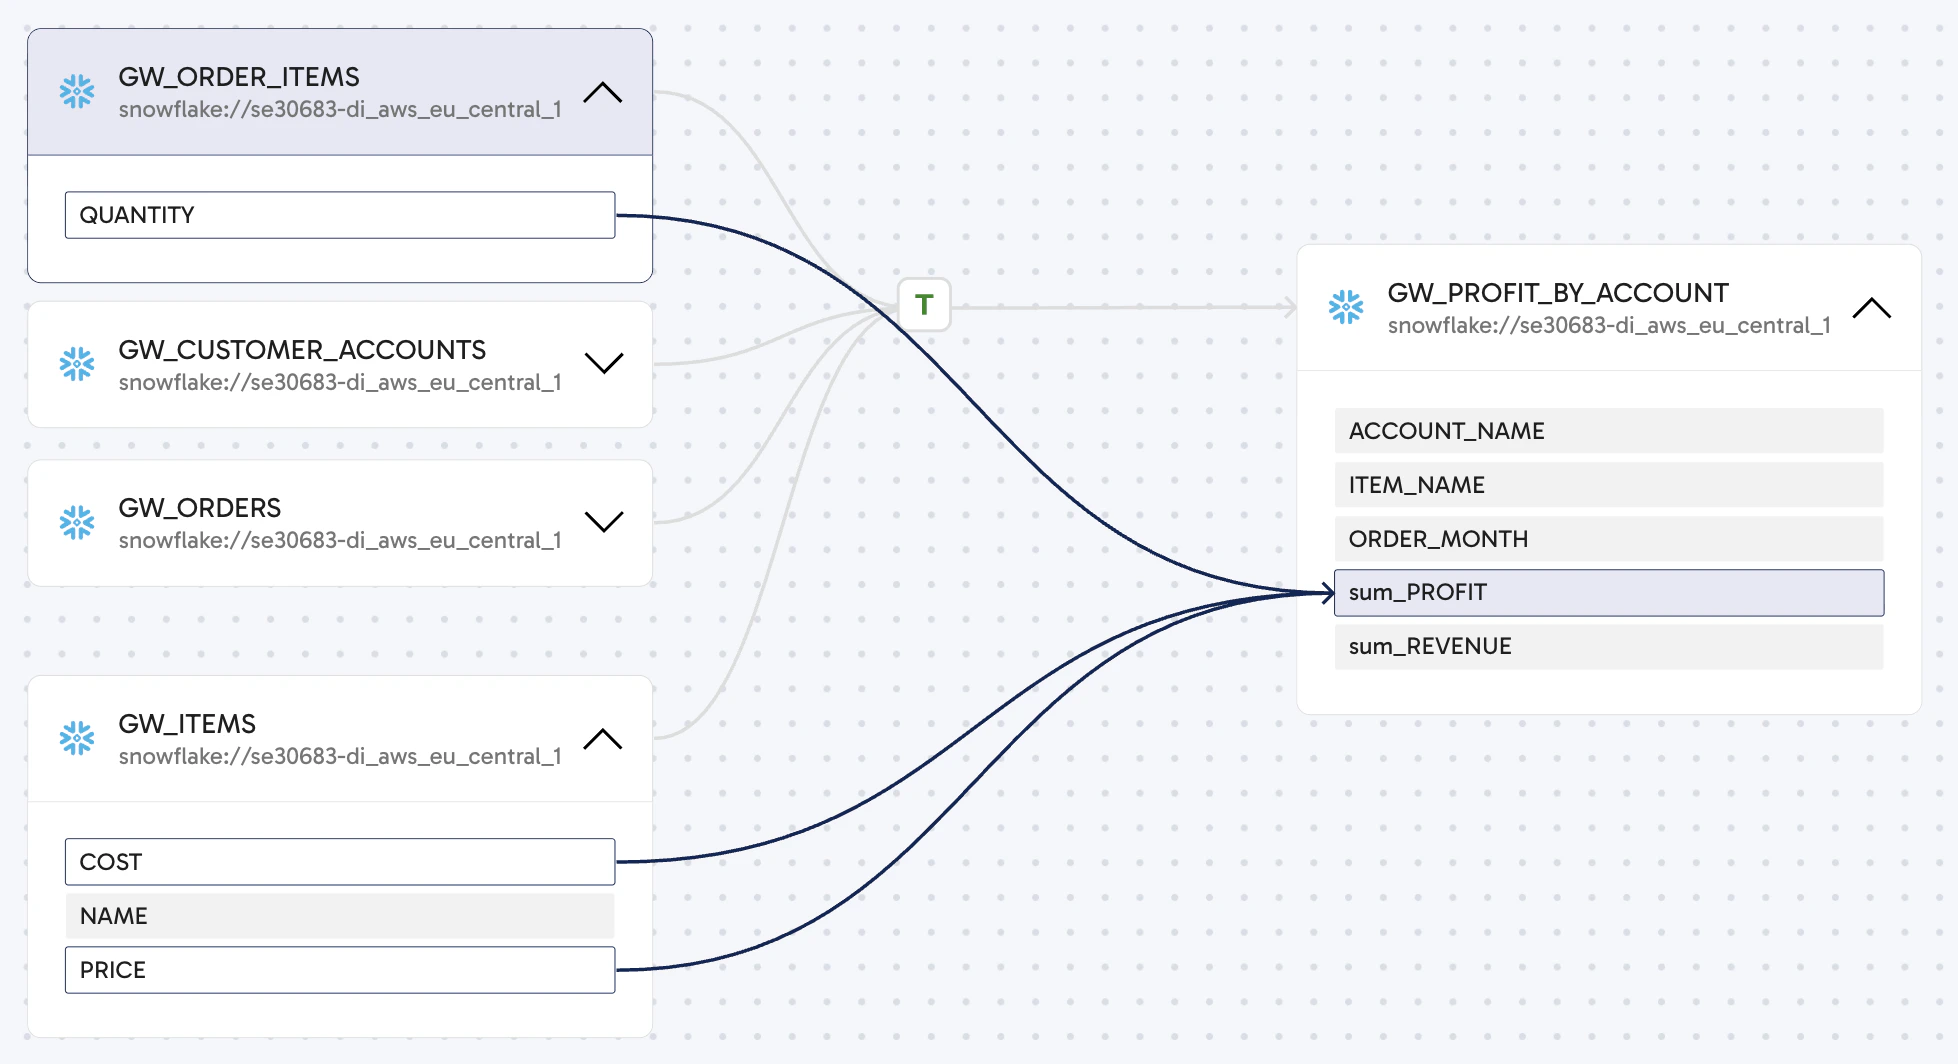
- Click the down arrow in any of the dataset boxes to expand the box, displaying every column in the dataset.
Filtering data lineage
Filtering data lineage views enhances the clarity of data flows in your pipelines. By applying filters to large datasets and pipelines, you can gain insights into the lineage without needing to view or load everything on the canvas. What can you use lineage for?- Upstream lineage: Quickly trace the origins of your data to perform root cause analysis, and understand how the dataset you’re analyzing is constructed.
- Downstream lineage: Perform impact analysis to see which datasets or columns will be affected if you make a significant change.
You can only select one filter at a time.
Data access control
Lineage metadata is collected and aggregated at the account level to provide a unified view across projects. Access is controlled by project-level user roles. Users can view metadata only for datasets that are read from or written to by projects they belong to. If a dataset is not associated with one of their projects, they can’t access its metadata.Exporting lineage data
You can export lineage data programmatically using the Get OpenLineage events endpoint. It returns a paginated list of OpenLineage events for a specified time period, including job runs, datasets, transformations, schema information, and column-level lineage. Use thegeneratedFrom and generatedBefore parameters to define the time range.
For authentication requirements, see Data lineage API authentication and permissions.