> ## Documentation Index
> Fetch the complete documentation index at: https://docs.maia.ai/llms.txt
> Use this file to discover all available pages before exploring further.
# Usage dashboard
export const maia = "Maia";
The usage dashboard provides a detailed breakdown of your credit consumption across your subscription. This data refreshes every **three hours** to reflect recent credit usage.
The dashboard is available to users who can manage billing for the account. Only users with the **Manage Billing** permission—held by the **Super Admin** and **Billing Admin** roles—can view it. For more information, read [Account roles](/docs/administration/account-roles#role-permissions).
***
## Accessing the usage dashboard
To access the usage dashboard, you need to [register](/docs/administration/registration) with {maia}. Once you have logged in to your {maia} account, access the dashboard through one of these methods:
* In the left navigation, click your Profile & Account icon. Then, select **Credit usage** in the menu.
* On the {maia} homepage, click the **Monitor credit usage** icon under **Quicklinks**.
***
## Consumption overview
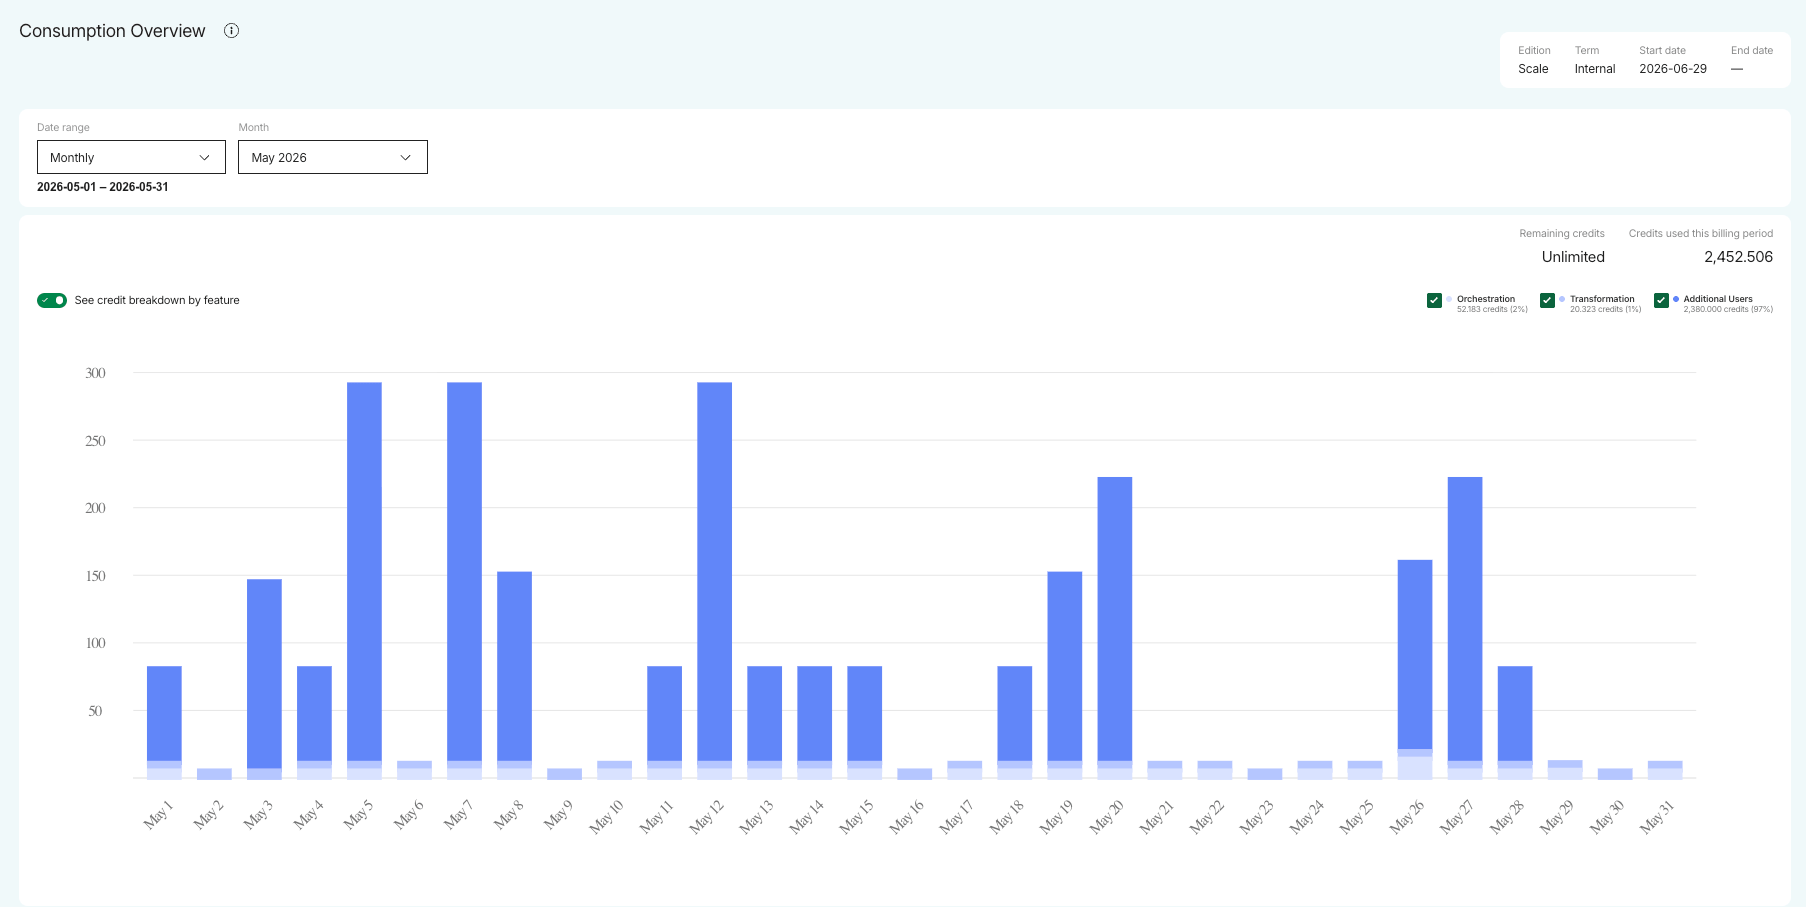
The consumption overview shows your plan details alongside a graph of your credit consumption over time.
 ### Plan details
At the top of the page you will see your account and subscription plan details:
| Plan detail | Description |
| ----------- | ------------------------------------------------------------ |
| Edition | The edition you're subscribed to. |
| Term | Your subscription term, such as Trial, Monthly, or Contract. |
| Start date | The start date of your active subscription. |
| End date | The end date of your active subscription. |
Usage is organized into tabs by product. Click a tab—such as **Maia Foundation** or **Matillion ETL**—to view consumption for that product.
### Enterprise trial ribbon
If you're currently on the **Enterprise trial edition**, you will see a ribbon with the following options:
### Plan details
At the top of the page you will see your account and subscription plan details:
| Plan detail | Description |
| ----------- | ------------------------------------------------------------ |
| Edition | The edition you're subscribed to. |
| Term | Your subscription term, such as Trial, Monthly, or Contract. |
| Start date | The start date of your active subscription. |
| End date | The end date of your active subscription. |
Usage is organized into tabs by product. Click a tab—such as **Maia Foundation** or **Matillion ETL**—to view consumption for that product.
### Enterprise trial ribbon
If you're currently on the **Enterprise trial edition**, you will see a ribbon with the following options:
 * Information about how many days are remaining in your trial period.
* Your remaining credits. Click [View Breakdown](#credit-breakdown) to view a breakdown of your usage consumption.
* **View pricing:** Opens the **Choose your edition** page which provides comprehensive information about each edition and subscription. You can explore each edition in detail by selecting the **Show all features** link to open the **Compare features** dialog. For more information, read [Editions](/docs/administration/editions) and [Marketplace subscriptions](/docs/administration/marketplace-subscriptions), respectively.
* **Talk to sales:** Opens the **Talk to an Expert** page which lets you send a message to our Sales team. Ensure you include the appropriate email address and phone number for the response.
### Selecting a date range
Use the **Date range** drop-down to control the time period shown in the consumption overview. You can select:
* **Last 7 days** or **Last 30 days**: the graph shows credit consumption for each day in the period.
* **Monthly:** Select a month from the **Month** drop-down. The graph shows credit consumption for each day of the selected month.
* **Quarterly:** Select a quarter from the **Quarter** drop-down, such as Q2 2026. The graph shows credit consumption for each month in the selected quarter.
* **Custom:** Use the date pickers to set a start date and an end date.
### Credit consumption graph
The graph shows your credit consumption for the selected date range. To the top right of the graph you can see:
* **Remaining credits:** The number of credits remaining against your allowance.
* **Credits used this billing period:** The total credits used during your current billing period.
Hover your mouse over a bar to see the credit consumption for that day or month, broken down by feature.
Customers on the trial edition can view how many credits they have used so far. Paying customers can see how many credits they have used over the selected period.
#### Credit breakdown by feature
Toggle **See credit breakdown by feature** on to break the graph down by feature. Select the checkbox for each feature you want to include:
* **Orchestration**
* **Transformation**
* **Streaming**
* **Additional Users**
Each selected feature shows its total credits consumed and its percentage of the total. Combine the feature checkboxes with the selected date range to focus on specific feature usage over a chosen period.
***
## Credit breakdown
The credit breakdown gives you a granular view of your credit usage, so you can observe where costs are accruing. It's organized into two tabs:
* **Projects & Pipelines:** Credit usage at the pipeline level.
* **Additional Users:** Charges for users added above your contracted limit.
The data respects the [date range](#selecting-a-date-range) you set in the consumption overview.
To export your consumption data, click the download icon, then click **Download data** in the **Download consumption data** dialog. The data downloads as a CSV file that you can use in third-party software to build your own reports.
### Projects and pipelines
The **Projects & Pipelines** tab lists your pipelines and the credits each has consumed. Filter the results using the following drop-downs, individually or in combination:
* **Project:** Select the checkbox for one or more projects in your account.
* **Environment:** Select the checkbox for one or more environments. The list shows the environments in the projects you've selected, or all environments if you haven't selected a project.
* **Feature:** Select the checkbox for **Orchestration**, **Transformation**, or both.
* Information about how many days are remaining in your trial period.
* Your remaining credits. Click [View Breakdown](#credit-breakdown) to view a breakdown of your usage consumption.
* **View pricing:** Opens the **Choose your edition** page which provides comprehensive information about each edition and subscription. You can explore each edition in detail by selecting the **Show all features** link to open the **Compare features** dialog. For more information, read [Editions](/docs/administration/editions) and [Marketplace subscriptions](/docs/administration/marketplace-subscriptions), respectively.
* **Talk to sales:** Opens the **Talk to an Expert** page which lets you send a message to our Sales team. Ensure you include the appropriate email address and phone number for the response.
### Selecting a date range
Use the **Date range** drop-down to control the time period shown in the consumption overview. You can select:
* **Last 7 days** or **Last 30 days**: the graph shows credit consumption for each day in the period.
* **Monthly:** Select a month from the **Month** drop-down. The graph shows credit consumption for each day of the selected month.
* **Quarterly:** Select a quarter from the **Quarter** drop-down, such as Q2 2026. The graph shows credit consumption for each month in the selected quarter.
* **Custom:** Use the date pickers to set a start date and an end date.
### Credit consumption graph
The graph shows your credit consumption for the selected date range. To the top right of the graph you can see:
* **Remaining credits:** The number of credits remaining against your allowance.
* **Credits used this billing period:** The total credits used during your current billing period.
Hover your mouse over a bar to see the credit consumption for that day or month, broken down by feature.
Customers on the trial edition can view how many credits they have used so far. Paying customers can see how many credits they have used over the selected period.
#### Credit breakdown by feature
Toggle **See credit breakdown by feature** on to break the graph down by feature. Select the checkbox for each feature you want to include:
* **Orchestration**
* **Transformation**
* **Streaming**
* **Additional Users**
Each selected feature shows its total credits consumed and its percentage of the total. Combine the feature checkboxes with the selected date range to focus on specific feature usage over a chosen period.
***
## Credit breakdown
The credit breakdown gives you a granular view of your credit usage, so you can observe where costs are accruing. It's organized into two tabs:
* **Projects & Pipelines:** Credit usage at the pipeline level.
* **Additional Users:** Charges for users added above your contracted limit.
The data respects the [date range](#selecting-a-date-range) you set in the consumption overview.
To export your consumption data, click the download icon, then click **Download data** in the **Download consumption data** dialog. The data downloads as a CSV file that you can use in third-party software to build your own reports.
### Projects and pipelines
The **Projects & Pipelines** tab lists your pipelines and the credits each has consumed. Filter the results using the following drop-downs, individually or in combination:
* **Project:** Select the checkbox for one or more projects in your account.
* **Environment:** Select the checkbox for one or more environments. The list shows the environments in the projects you've selected, or all environments if you haven't selected a project.
* **Feature:** Select the checkbox for **Orchestration**, **Transformation**, or both.
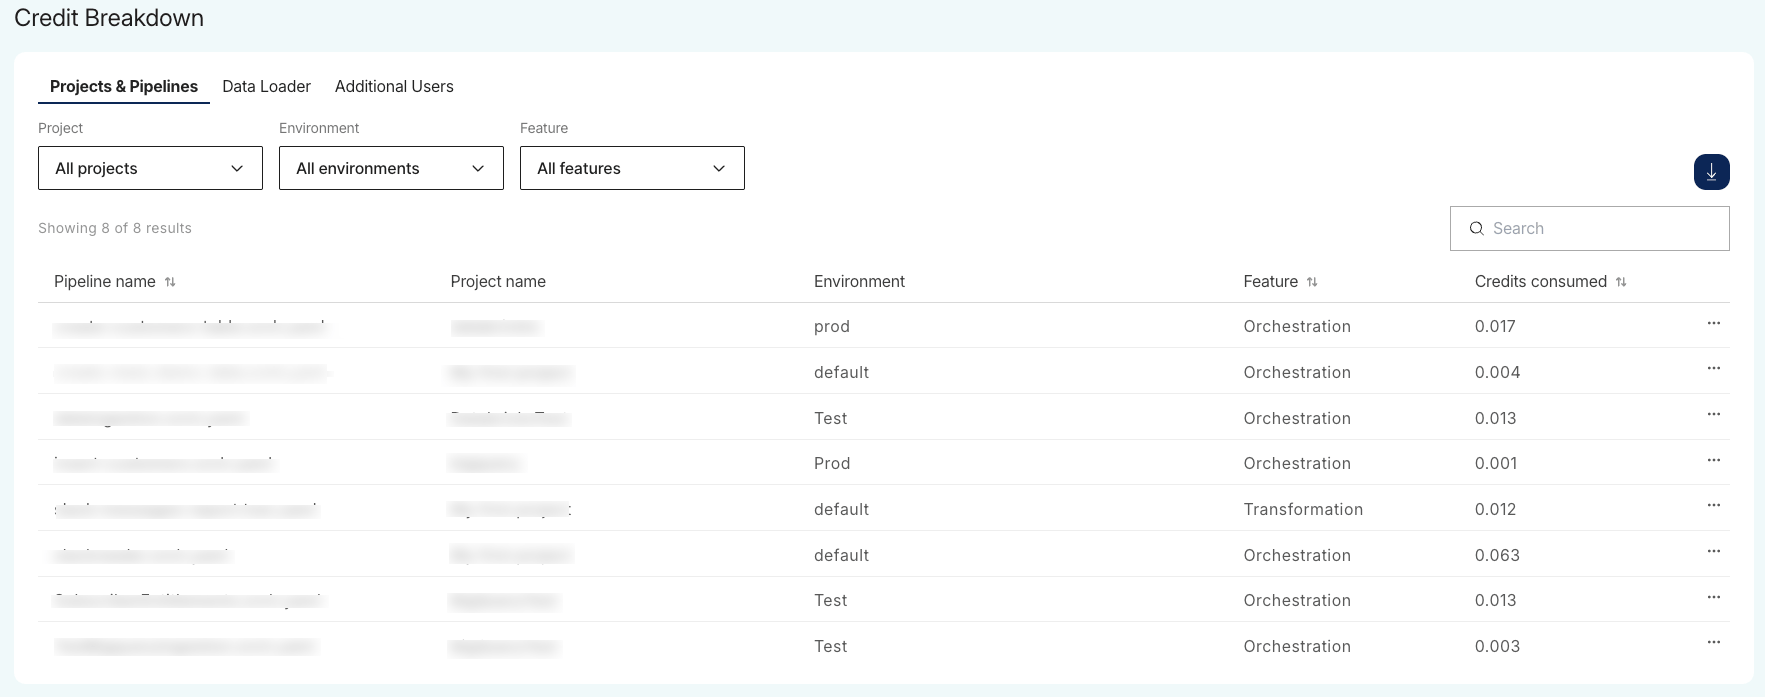 The table includes the following columns:
| Column header | Description |
| ---------------- | ------------------------------------------------------------------------------- |
| Pipeline name | The name of the pipeline that consumed the credits. |
| Project name | The project the pipeline belongs to. |
| Environment | The environment the pipeline ran in. |
| Feature | The feature that consumed the credits, such as Orchestration or Transformation. |
| Credits consumed | The number of credits the pipeline consumed. |
You can also interact with the table in the following ways:
* **Sort:** Click the up/down arrows in the **Pipeline name**, **Feature**, or **Credits consumed** column header to reorder the rows.
* **Search:** Use the search bar to find a pipeline by name.
The same data is also available through the [Consumption API](/api-reference/consumption/get-a-breakdown-of-your-credit-consumption-for-flat-rated-products) for further reporting.
#### View daily breakdown
To see a single pipeline's credit consumption day by day, click the options (**...**) menu in its row and select **View daily breakdown**.
The daily breakdown page shows the pipeline's credit consumption for the date range set in the consumption overview. At the top of the page you can see the total **Credits consumed** and the **Date range**. The table lists each **Date** and the **Credits consumed** on that date.
### Additional users
The **Additional Users** tab provides visibility into individual user credit charges. This tab tracks users who have been added to the account above the limit defined in your base contract.
Use the **Users** drop-down to filter by specific users.
The table includes the following columns:
| Column header | Description |
| ---------------- | ------------------------------------------------------------------------------- |
| Pipeline name | The name of the pipeline that consumed the credits. |
| Project name | The project the pipeline belongs to. |
| Environment | The environment the pipeline ran in. |
| Feature | The feature that consumed the credits, such as Orchestration or Transformation. |
| Credits consumed | The number of credits the pipeline consumed. |
You can also interact with the table in the following ways:
* **Sort:** Click the up/down arrows in the **Pipeline name**, **Feature**, or **Credits consumed** column header to reorder the rows.
* **Search:** Use the search bar to find a pipeline by name.
The same data is also available through the [Consumption API](/api-reference/consumption/get-a-breakdown-of-your-credit-consumption-for-flat-rated-products) for further reporting.
#### View daily breakdown
To see a single pipeline's credit consumption day by day, click the options (**...**) menu in its row and select **View daily breakdown**.
The daily breakdown page shows the pipeline's credit consumption for the date range set in the consumption overview. At the top of the page you can see the total **Credits consumed** and the **Date range**. The table lists each **Date** and the **Credits consumed** on that date.
### Additional users
The **Additional Users** tab provides visibility into individual user credit charges. This tab tracks users who have been added to the account above the limit defined in your base contract.
Use the **Users** drop-down to filter by specific users.
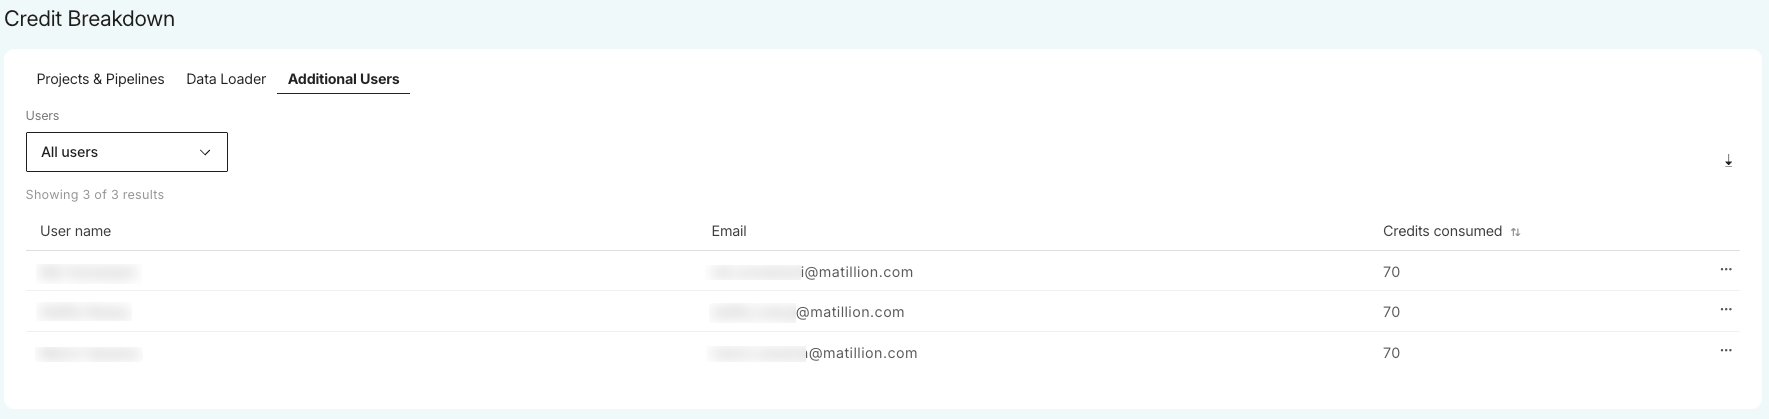 The table includes the following columns:
| Column header | Description |
| ---------------- | ------------------------------------------------------------------------------------ |
| User name | The name of the user who incurred the charge. |
| Email | The email address of the user. |
| Credits consumed | The number of credits attributed to that user for exceeding the contract seat limit. |
To see a user's credit consumption day by day, click the options (**...**) menu in their row and select **View daily breakdown**.
The table includes the following columns:
| Column header | Description |
| ---------------- | ------------------------------------------------------------------------------------ |
| User name | The name of the user who incurred the charge. |
| Email | The email address of the user. |
| Credits consumed | The number of credits attributed to that user for exceeding the contract seat limit. |
To see a user's credit consumption day by day, click the options (**...**) menu in their row and select **View daily breakdown**.